From one plant to fifty-five.
The unit economics for a single 10 TPD plant, then the path to a 55-plant global enterprise. Full financial models including sensitivity analysis, scenario modelling, and offtake-pricing walkthroughs are available to accredited investors via Ardana Capital.
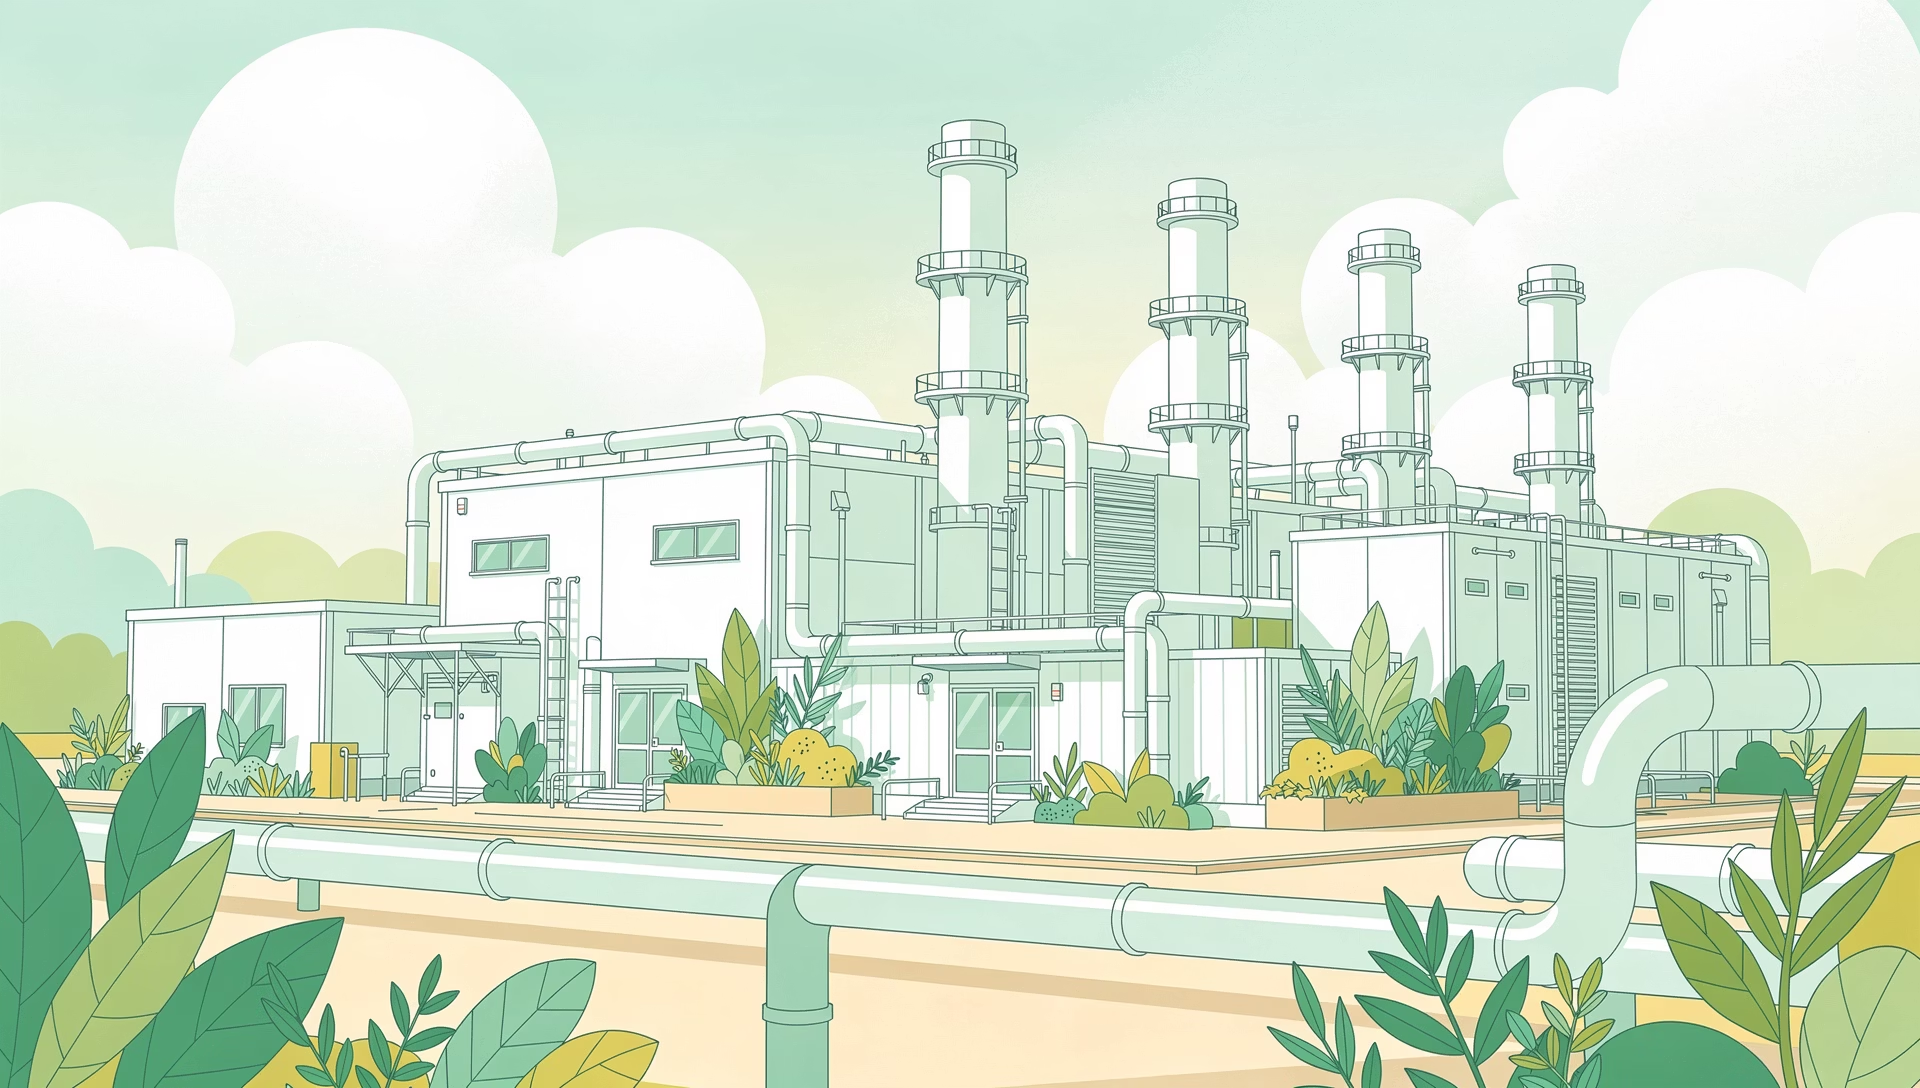
10 TPD waste-to-hydrogen facility. One unit of the global scale-out.
| Metric | Value |
|---|---|
| Plant Capacity | 10 TPD MSW |
| H₂ Production | 989 T / year |
| H₂ Selling Price | ₹2,80,000 / T (~$3,340 USD/T) |
| Annual H₂ Revenue | ₹2,769.20 Lakhs · ~$3.30M USD |
| Carbon Credit Price | $50 USD / T CO₂e · ₹157.50 Lakhs/yr |
| Total Revenue · Year 1 | ₹2,941.70 Lakhs · ~$3.50M USD |
| Total Annual OPEX | ₹383.66 Lakhs · ~$457K USD |
| EBITDA · Year 1 | ₹2,558.04 Lakhs · ~$3.05M USD |
| EBITDA Margin · Year 2+ | 87.0% |
| Total Equipment CAPEX | ₹2,420 Lakhs · ~$2.88M USD |
| Net Project Cost (post-loan) | ₹1,573 Lakhs |
| Monthly EMI | ₹37.143 Lakhs |
| DSCR · Year 1 | 5.74x |
| Average DSCR Y1–5 | 5.74x |
| Loan Closes | 60th EMI |
| Simple Payback | <1 Year (EBITDA basis) |
| 15-Yr Cumulative Revenue | ₹44,167.50 Lakhs |
| 15-Yr Cumulative PAT | ₹30,562.71 Lakhs · ~$36.4M USD |
No government subsidy assumed in this model. Carbon credit revenue at $50/T CO₂e listed price (Verra / Gold Standard pending). Conservative estimate — actual realised pricing in EU CBAM-linked offtake contracts trending higher.
How we get to 87% EBITDA.
FX: INR/USD 90 (mid-2024 avg) · 1 Lakh = INR 100,000 · Annual projections, 10 TPD unit
Revenue — Three Simultaneous Streams
Annual OPEX — 13% of Revenue
$199k
O&M
$98k
Salaries
$87k
Water
$43k
Electricity
$3.27M revenue
−
$427k OPEX
=
87%
EBITDA Margin
$2.84M EBITDA
① Three revenue streams,
not one. H₂ sales carry the model; tipping fees and carbon credits are additive.
② Feedstock is free.
MSW is a liability for municipalities — we're paid to take it, not the reverse.
③ No grid dependency.
Plasma power is self-generated from syngas. Electricity cost is internal.
$2.69M
Equipment CAPEX
35%
MNRE Subsidy
5.74×
DSCR Year 1
<1 yr
Simple Payback
63.6%
PAT Margin Y1
Based on Ardana proprietary KPI financial model v3 for a 10 TPD MSW plasma gasification unit. H₂ price $3,111/T, carbon credit $50/T CO₂e. USD at INR/USD 90 (mid-2024 avg). For reference only.
The path to a multi-billion-dollar green hydrogen enterprise.
India
Plant deployments
MSW · captive municipal partnerships
SWM Rules 2026 mandates create immediate offtake demand.
GCC
Plant deployments
Oil sludge · refinery-adjacent siting
UAE / KSA / Oman net-zero targets + sovereign carbon mandates.
10-Year Cumulative Revenue
Across 55 plants at full deployment
10-Year Cumulative Net Profit
After debt service + tax · run-rate basis
Projected Enterprise Value
10x–15x stabilised EBITDA · green infra multiples
Target Annual ROI · ~25.3% · Expanding Post-Debt Amortisation